Plotting curves and surfaces using Matplotlib
The plot submodule in bertini_real uses matplotlib, and allows you to render the decompositions computed by bertini_real.
Matplotlib: Plotting a Curve/Surface
After decomposing a surface, you can run the following python codes to plot curve/surface in the Python Shell. We are plotting a curve Alpha Curve and a surface “Whitney” in this example ☂️ .
Decomposition is covered in more detail in Introduction to Bertini_real’s Python Visualization Suite
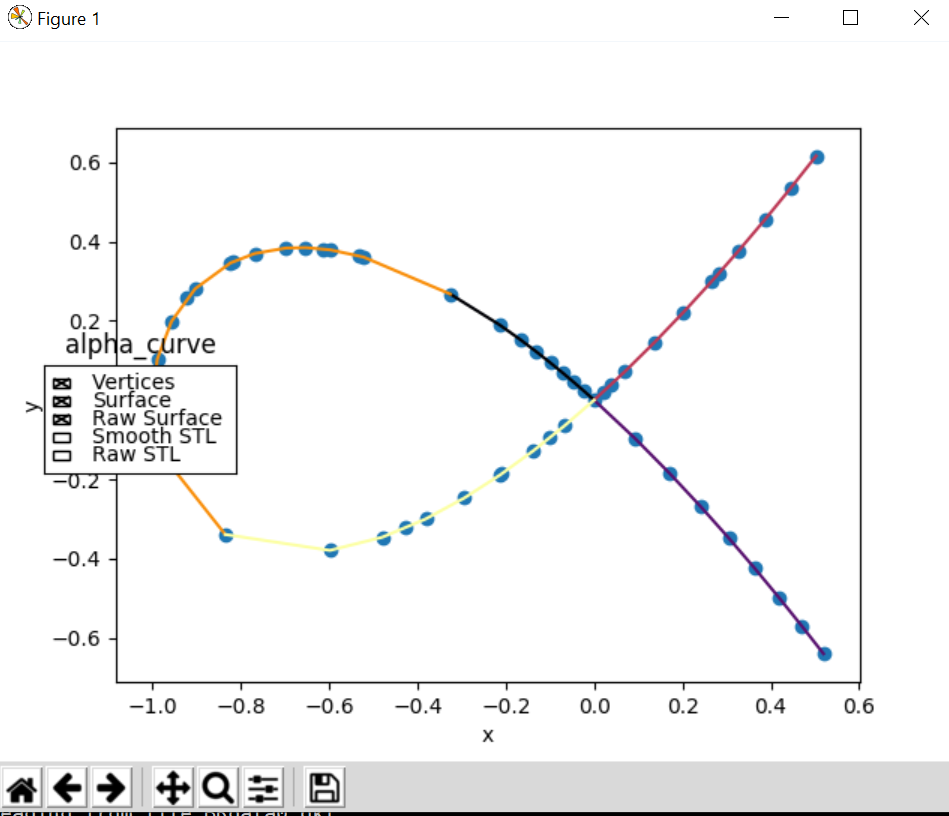
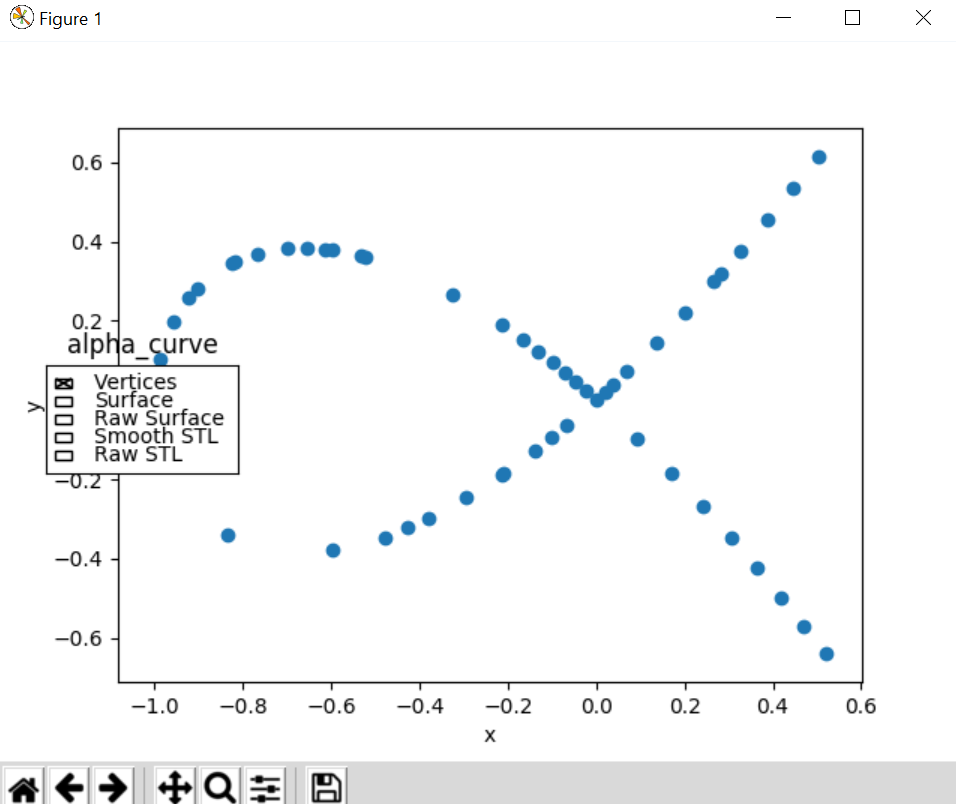
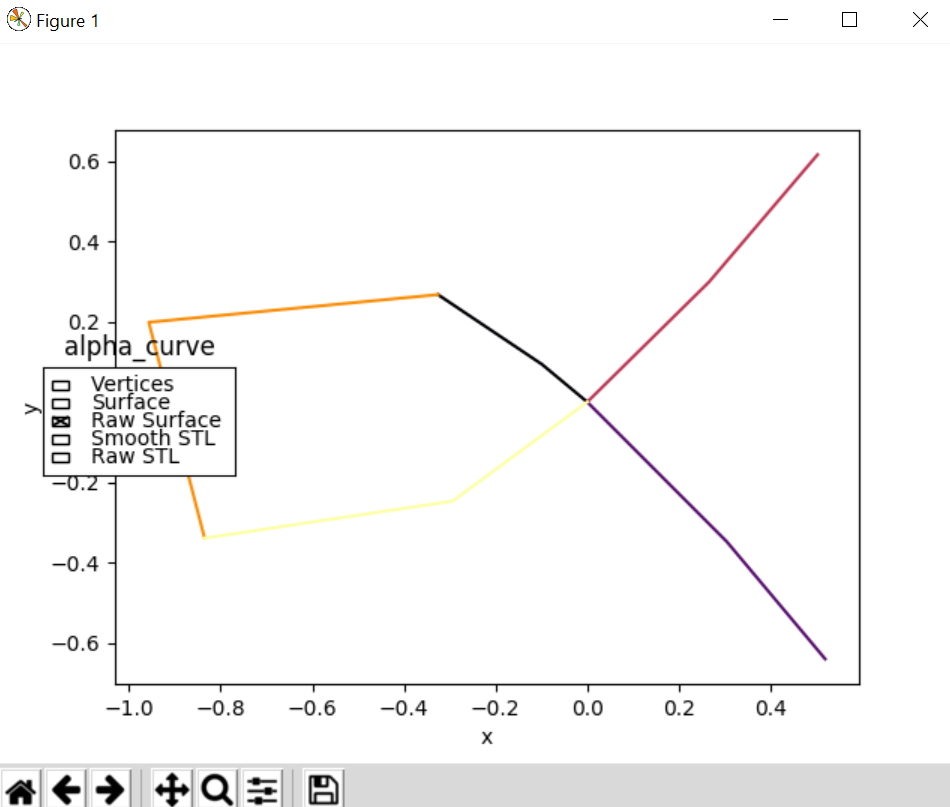
Example: Alpha Curve
import bertini_real

bertini_real.data.gather_and_save()

curve = bertini_real.data.read_most_recent()

bertini_real.plot.plot()

Example: Whitney
import bertini_real

bertini_real.data.gather_and_save()

surface = bertini_real.data.read_most_recent()

bertini_real.plot.plot()
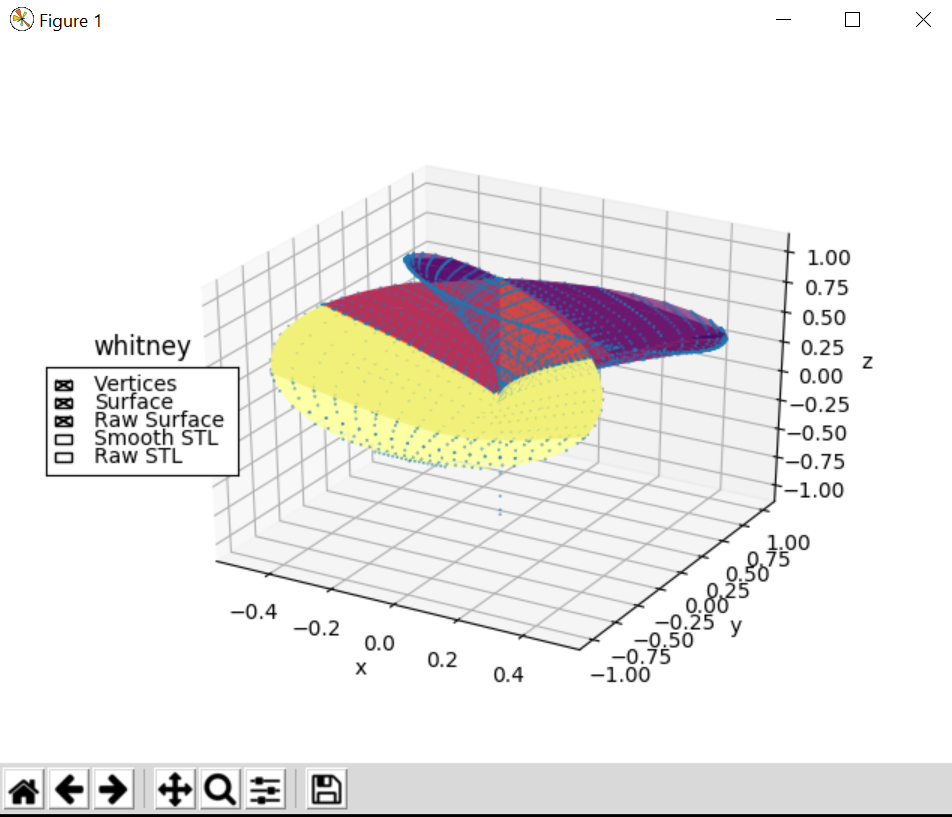
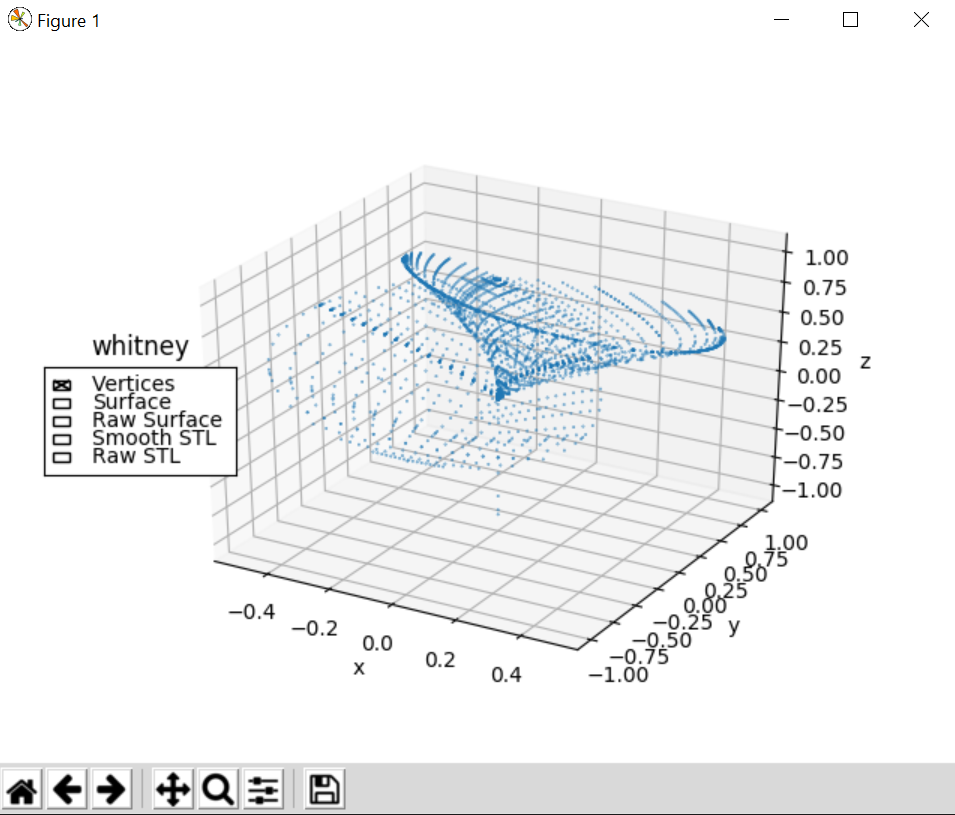
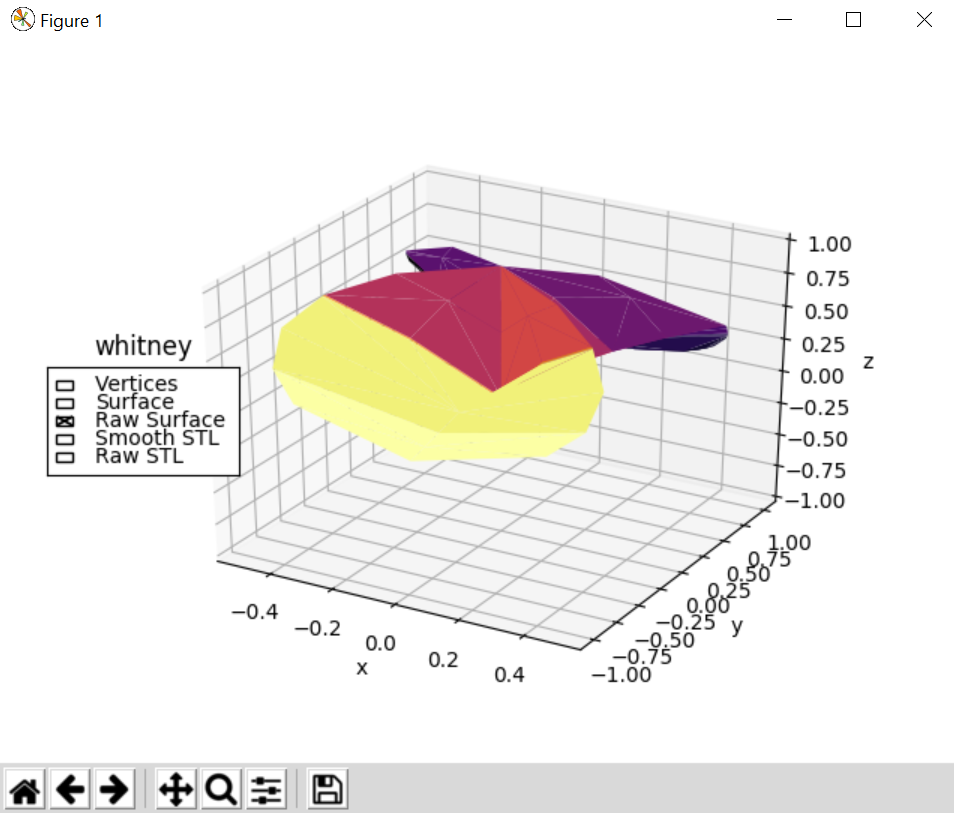
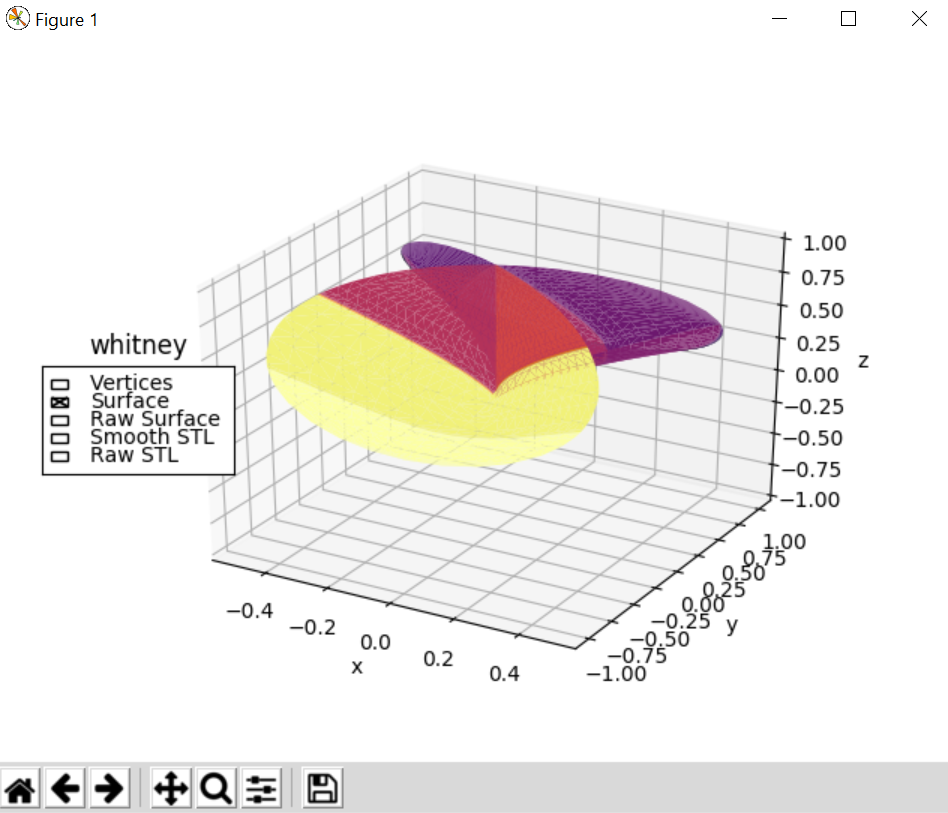
Checking Smooth STL or Raw STL will export a 3D model to your current folder.
Caution The plot pop-up must be closed before continuing in the shell.
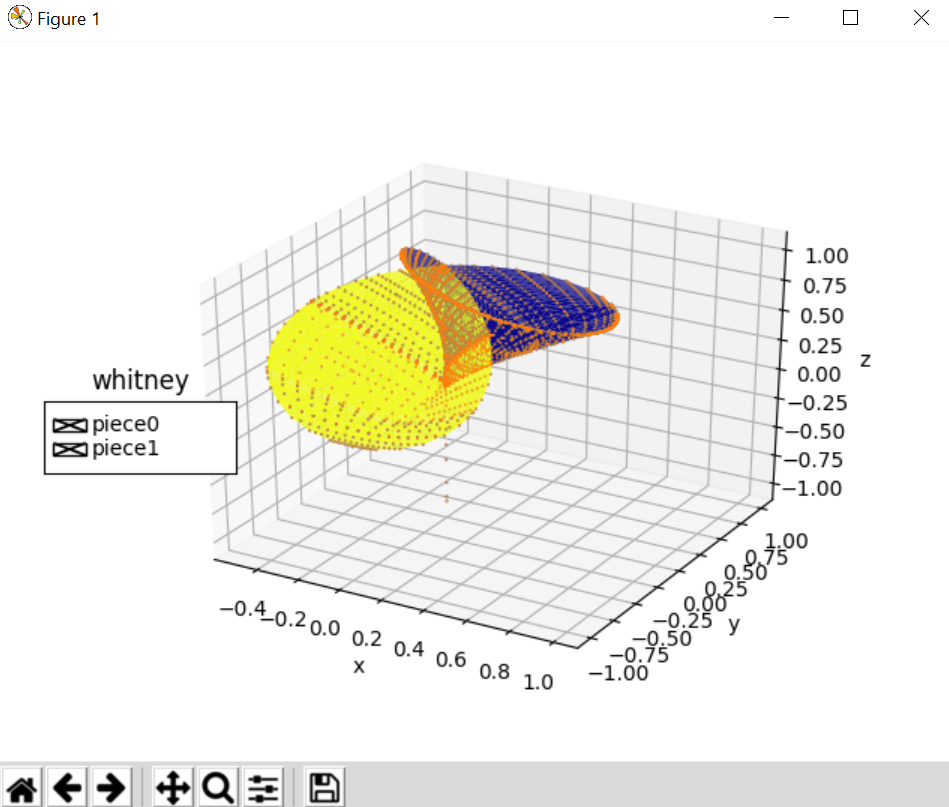
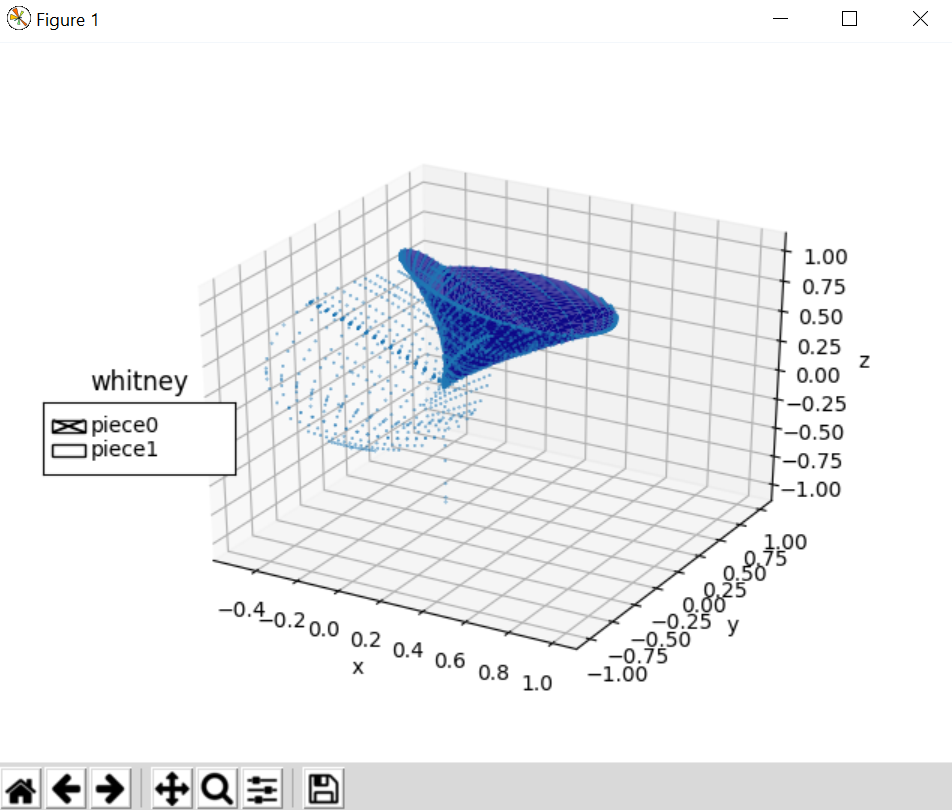
Matplotlib: Plotting Pieces
Plotting pieces is only available for surface.
Example: Whitney
import bertini_real

surface = bertini_real.data.read_most_recent()

pieces = surface.separate_into_nonsingular_pieces()

bertini_real.surface.plot_pieces(pieces)
- Author
Foong Min Wong, Caden Joergens
- Version
1.0 2021-10-08